 skylar payne
Writing / An essay
Why Are We Reverse-Engineering Our Own Agent Runs?
If you built the agent, why are you extracting its task from chat traces instead of recording typed inputs and outputs at the source?
In this note
I read Laminar’s post on extracting tasks from agent runs, and instead of being awed at an otherwise cool solution, I couldn’t stop thinking: why do we need to extract the task?
Their problem is real. They receive traces from agents they didn’t build. The user’s request might be one line inside a message full of timestamps, repository state, attachments, and instructions from the agent’s harness. Laminar has to meet customers where they are; regardless of how bad their traces are set up. So they compare runs to learn which parts of a message are stable, generate an extraction regex for each prompt template, and deal with the template changing underneath them. It’s clever, and they have good reasons to do it that way. They can’t ask every customer to rebuild their agent around Laminar’s preferred interface.
But I’m looking at it as somebody who can change the agent. If we knew what task we were launching, why would we wait until it reached the observability backend and then make another AI system dig it back out of the messages? It feels insane.
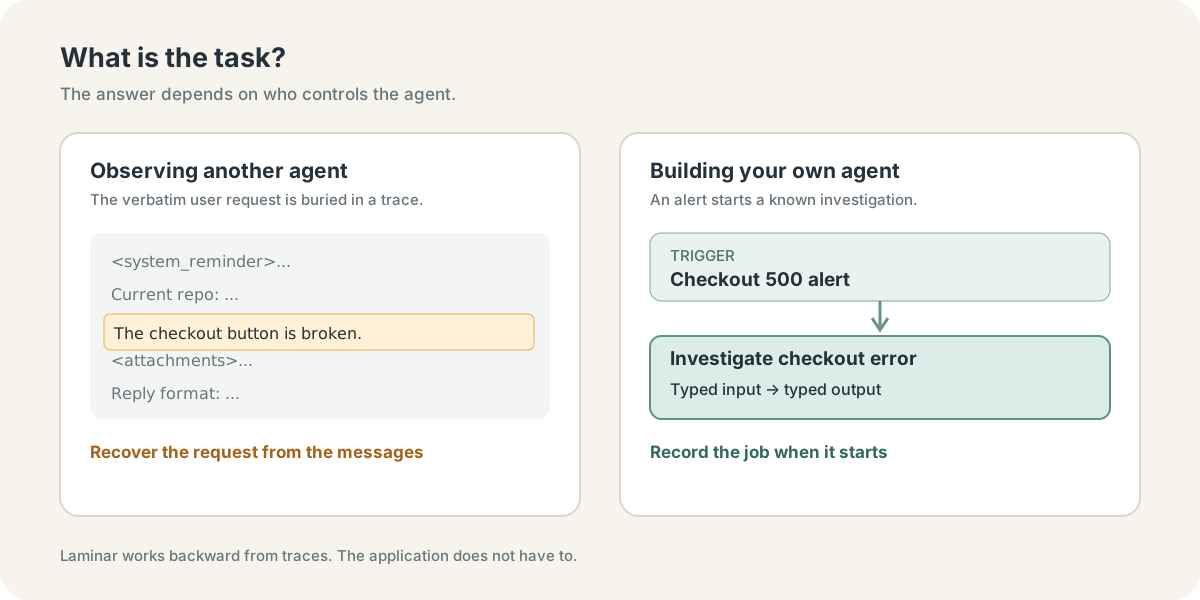
Laminar works backward from traces. But we control the application! We don’t have to!
A checkout error and a pretty reasonable first version
Imagine an agent that investigates issues when alerts fire. Say your checkout code throws a 500. We want the agent to look around and tell us what’s going on.
The first version is straightforward: use an off-the-shelf agent framework, or make the model request yourself. Keep a general system prompt in a string. Make a user prompt template, put the alert details into it, give the agent tools for investigating, and send it off. You can get a prototype running quickly. I would probably start there too.
Now let it run for a while. At some point you want to understand the data. How many 500s did it investigate? Where in the code were the errors thrown? Which downstream systems did its investigations say were affected? Which findings were useful?
Open the traces and you have… chat messages. The error code and stack trace may be embedded in a rendered prompt. The file and line number might be in another part of the alert text. The agent’s conclusion is in its final reply, or spread across replies and tool calls. To answer a question that sounds like a database query, you first have to figure out which piece of each message corresponds to which field. Then somebody changes the prompt template. Now you have two formats to account for.
You can use another model to extract that information later. That’s the sort of recovery work Laminar does when it has no control over how an agent was authored. But if this is our checkout agent, we already had the alert fields before we formatted the prompt. We also chose what kind of result we wanted the investigation to produce. So why the fuck are we making our own data harder to use?
The part we should have defined first
David Chapman writes in How To Think Real Good: “Finding a good formulation for a problem is often most of the work of solving it.” I think that applies rather literally here. Before deciding how to prompt the investigator, we should decide what an investigation is in our application.
For this example, the inputs could include the error code, stack trace, and where the error was thrown in the code. The outputs might include a finding with its suspected cause, affected downstream systems, evidence it relied on, and what it still doesn’t know. Those output fields are a design choice that makes downstream analysis easier!
Here’s the shape I mean. This is application pseudocode, not an SDK integration claim:
@dataclassclass IncidentInput:    alert_id: str    error_code: int    file: str | None    line: int | None    stack_trace: str
@dataclassclass Investigation:    suspected_cause: str | None    affected_systems: list[str]    evidence_refs: list[str]    uncertainty: str
async def investigate(    incident: IncidentInput,    tools: InvestigationTools,) -> Investigation:    ...  # Prompt and tool-use strategy live in here.
A real implementation will have more context and probably more than one model call. That’s fine. Inside investigate, you can fashion the prompts however you want. The prompt might change from one model to another, or you might replace the agent framework entirely. The caller still knows what it passed in, and the consumer knows what comes back. That’s the separation between what the system is doing and how we’ve currently tricked a model to do it.
DSPy signatures are a good example of this for a model-facing step: name inputs and outputs first, then work out the prompting strategy. You don’t have to use DSPy to put a domain model around the investigator, and a signature doesn’t automatically describe every tool call in a multi-step agent. I think people sometimes focus on DSPy’s optimizer before noticing how much gets easier when the task is explicit.
You also have to carry this information into observability deliberately. Typed Python classes sitting in a repo don’t make telemetry queryable by magic. At the task entrypoint, we need to emit a stable task name and version, safe input fields, the validated output, and references to the tool responses the agent saw. Keep the tool spans linked underneath. A trace might then have a root record like this:
task: investigate_checkout_error / v1input: {alert_id, error_code: 500, code_location, stack_trace_ref}output: {suspected_cause, affected_systems, evidence_refs, uncertainty}context: {prompt_version, model_version, tool_snapshot_refs}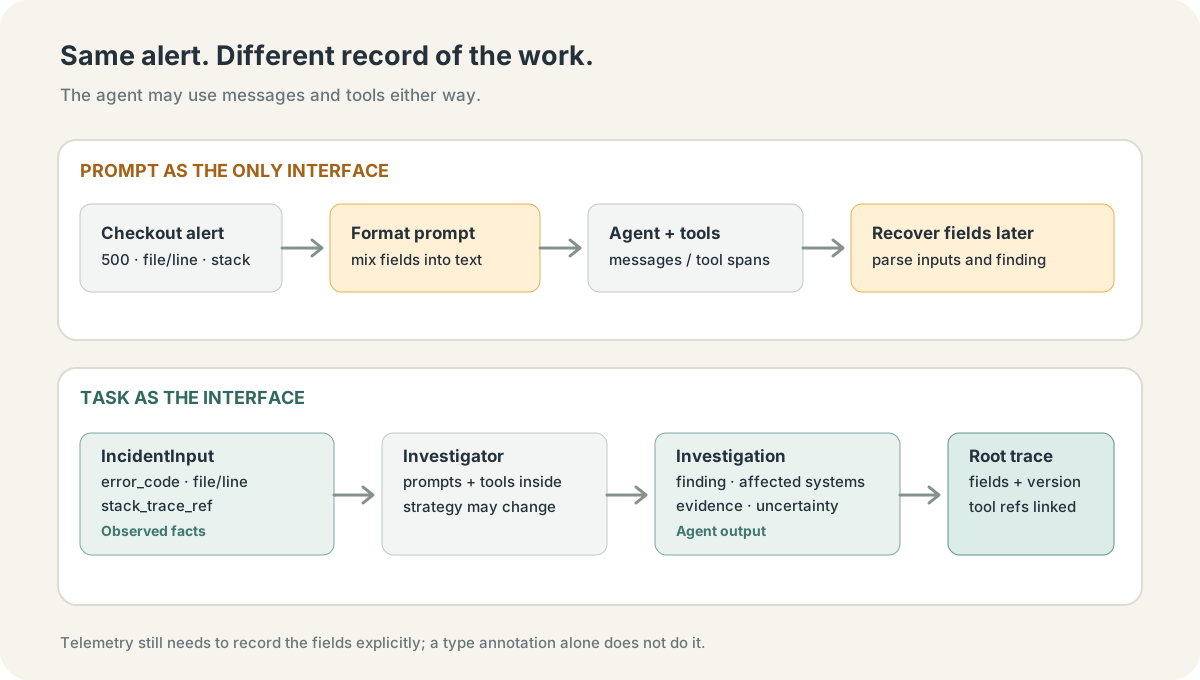
The same alert, with the task structure recorded before it becomes messages.
Integration gets less weird
Suppose the alert handler knows the error code, stack trace, file and line number. With the typed version it maps those into IncidentInput and calls investigate. The incident UI, or whatever writes the ticket for the on-call engineer, reads Investigation. Nobody downstream has to scrape the phrase “possibly payments-service” out of a paragraph and decide whether that means an affected dependency or a suspected cause.
That doesn’t mean the agent must stop writing a useful explanation for a human. But if we change the prompt next week, the alert handler and ticket writer don’t have to change with it. If we change the meaning of an output field, we version that contract and update consumers instead of quietly letting the prose drift.
Testing gets a place to start
The same contract gives us a testable seam. Take one captured checkout alert, pass its fields into investigate, replace the log and metrics tools with recorded responses, and inspect the returned Investigation. Did the output validate? Are the cited evidence references among the responses the agent actually received? Does it leave the cause uncertain when those responses don’t support one?
Those checks won’t tell us whether the true root cause was found, but we can test the application integration without coupling every assertion to a particular prompt wording.
Now the analytics question is boring
We wanted to know how many checkout 500s the agent investigated. If task and error_code are recorded separately, that’s a normal query. We can break those runs down by code location, prompt version, or the affected systems the agent reported. We can find investigations that returned no evidence, or compare how the output changed after a model swap.
Of course, there will be some analysis we want to run where we have not historically extracted a required field into inputs/outputs. But when you find those cases: you can evolve your schema and promote them to first class attributes in your domain model!
Change one thing and see what happens
Once we can point to the inputs for a specific investigation, we can try a controlled variation. Keep a captured checkout alert and its recorded tool results fixed, but change the error code or remove one piece of evidence. Does the finding respond appropriately? Does it keep claiming that a particular downstream system was affected after we remove the evidence for it?
This is much harder to interpret if we let the agent query live production again. Then the world changes along with the input, and we no longer know what produced the difference. Even with a fixed fixture, model outputs can vary, so we should run more than one trial. The explicit task gives us a way to set up the comparison!
An eval case already has a shape
The input, captured tool responses, and output give us a candidate dataset row. We don’t need to infer from a prompt template where one example begins and another ends. We can pull a group of checkout investigations, review the ones with interesting findings or failures, and turn some of them into eval cases.
Someone still needs to judge whether the cited evidence supported the finding and whether the response would have helped the on-call engineer. That work is hard. But reading hundreds (or thousands) of messages just to reconstruct the arguments to a function is hard for a different, avoidable reason.
The prompt becomes a parameter
There’s another useful distinction in the code. The error code, stack trace, and location are dynamic inputs: they change with every incident. The instructions about how to investigate are relatively stable. Once those aren’t all flattened into one opaque string, we can change the instructions while holding our cases and task contract steady.
This is where optimization tools like GEPA become interesting. Give an optimizer a set of cases and feedback about the results, and it can propose changes to a model-facing step’s instructions, run those cases again, and compare. If our feedback rewards confident guesses, it will optimize for confident guesses. A typed result doesn’t supply a good metric. But at least we know which part is an input from this incident and which part is a candidate instruction we want to improve.
Could we run the investigator without production?
I think the further-reaching version of this idea is to make the investigation callable outside the live system. Save the inputs, model and prompt versions, clock, prior state that matters, and the tool responses the agent actually saw. Then run investigate against recorded or sandboxed tools. A recommendation in its output is data for a human or another gated process; the replay has no way to perform a production remediation.
This doesn’t mean the agent is a pure function, exactly. A multi-step agent may depend on state, changing tools, and a model that answers differently twice. We have to capture and control those things at the boundary we’re replaying. But if the application has a real input and output contract, there’s somewhere to plug the recorded world in. In contrast, if all we have is a transcript and live tools, we’re back to reverse engineering the agent run!
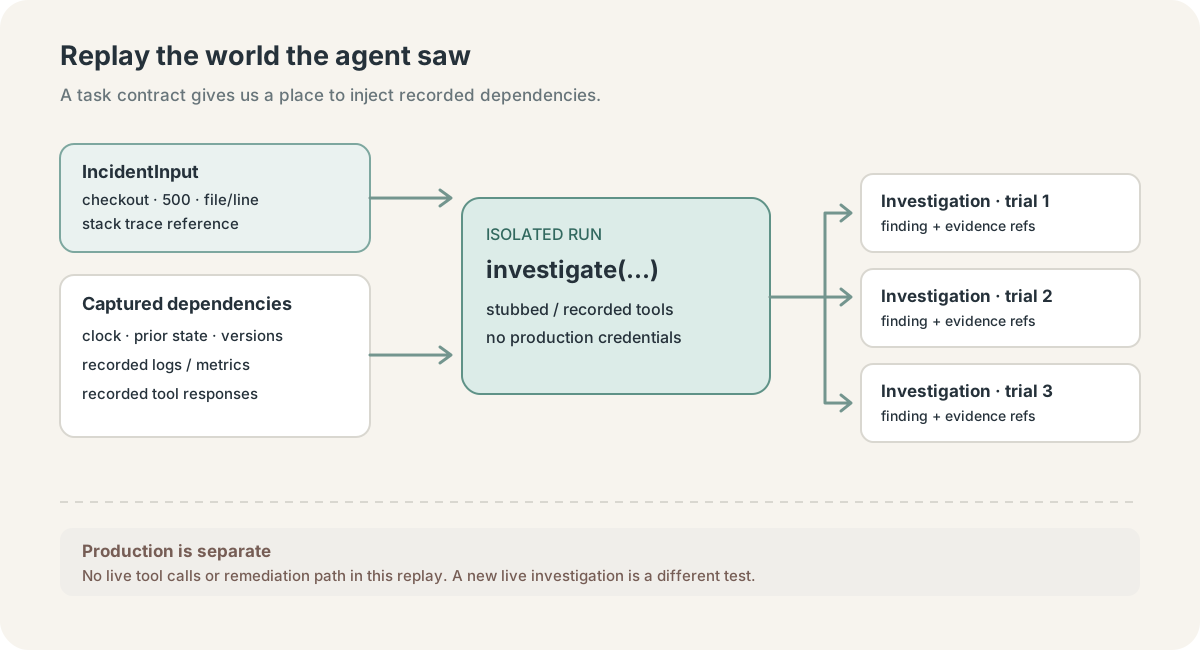
Replay the world the agent saw, not the live world today.
You don’t need to rebuild the agent to improve its observability. Start where your application launches one kind of task. For the checkout investigator, record a task name and version, the alert fields you already have, and the shape of the finding you expect back. Validate and record that finding, and link it to the prompt version and tool calls from the same run. Keep the chat trace for debugging; just stop making it the only record of what happened.
Try answering one question from those records: how many checkout 500s did we investigate, what did the agent conclude, and what evidence did it cite? Whatever still sends you digging through messages tells you what to capture next.